How Far Will Your Racer Go
Build racer. Explore variability in distance traveled. Test effect of changing weight. Graph data and use to predict.
Cycle Type
Contextualized Math
This is the Contextualized Math cycle type. Cycle types used to organize cycles by categories.
Maker Mindset
During maker projects, participating productively as part of a group generally leads to better and more robust work. Pooling and building on each other’s ideas creates better maker designs and products. Likewise, solving mathematics problems or building a mathematical model is a creative process that benefits from collaboratively generating and/or vetting ideas and working together.
Guessing is low risk and creates curiosity. We know guesses are usually wrong, so students feel safe floating new ideas. Predicting is an explicit part of the process, and they are supposed to guess, not demonstrate knowledge. Coming up with a guess makes students think about parameters for reasonable answers and aspects/variables of the situation. This habit of mind applies equally to maker and mathematics situations.
Maker tasks encourage trying out design ideas early to see if they are feasible. If they work, they are revised and improved upon. If they don’t, they are replaced by new ideas quickly without losing too much time pursuing dead-ends. This habit of mind also applies to mathematics. While solving math problems, students should test their ideas early. Will an idea lead to answers that is reasonable rather than too big or too small? If we are writing a general expression or equation, does it work for small cases? Can we tell without solving if a solution will be positive or negative?
During maker projects, students are encourage to scout out the projects of other groups and to incorporate and build on (or reject) scouted ideas into their own designs. Making is a social and open endeavor where all ideas are common property with the goal to create the best overall product. This habit of mind is also valuable within mathematics. Worthwhile mathematics often affords many entry points and approaches. Students can benefit from comparing their own ideas to their peers so that they can combine or adopt other’s ideas in their own mathematical work.
CC Standards:
CCSS.MATH.CONTENT.8.SP.A.1, CCSS.MATH.CONTENT.8.SP.A.2, CCSS.MATH.CONTENT.8.SP.A.3, CCSS.MATH.CONTENT.6.SP.A.1, CCSS.MATH.CONTENT.6.SP.A.2, CCSS.MATH.CONTENT.6.SP.A.3, 6.SP.A, 6.SP.B, 6.EE.C.9, SMP1, SMP6
You can find descriptions of all common core math standards at Common Core Math Standards
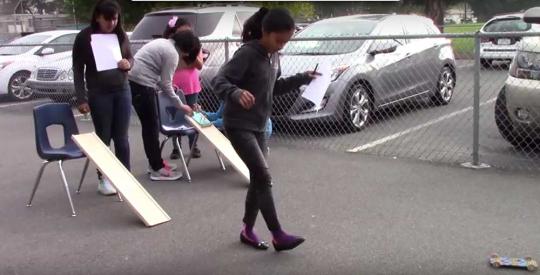
In the challenge, students teams will build a racer from given materials that travels as far as possible down a given ramp and across the floor.
Students will discuss factors that might influence how far a racer travels, and the class will explore the influence of weight on distance traveled.
Each team will gather data for their car with varying weights, and graph the data on a distance vs. added weight graph. They will use this data to predict distance traveled for other weights.
The cycle is designed to take two 55-minute class periods.
The mathematics foci are developing an understanding of statistical variability; summarizing and describing distributions (via the mean and dot plots); and representing and (qualitatively) analyzing quantitative relationships between dependent and independent variables. Standards of Mathematical Practice 1 (Make sense of problems and persevere in solving them) and 6 (Attend to precision) are particular foci.


About the Math
There is a surprising amount of descriptive statistics available in these activities. The most important 6th grade content here is understanding and representing statistical variability via dot plots, discussing choosing a “typical” value for a variable quantity (a “measure of center”), and using the mean as a specific type of measure of center.
The activities here give practice in using the mean (“average”) to represent a “typical” value, plotting pairs of values on a coordinate plane (including choosing scales for the axes), and interpreting patterns or trends that students see on the graph. The graph typically shows an upward trend (more weight leads to greater distance), to a point: too much weight can cause the car to have issues like increased friction or something breaking.
Note that the convention when graphing of placing the “independent variable” (the quantity “causing” the change in the other quantity) on the horizontal axis, and the “dependent variable” (the quantity whose value “depends on” the other) on the vertical axis, is simply a convention. There is no mathematical reason why this is preferable to the alternative. But it is useful to have an agreement so we display things the same way, and this is the convention that scientists, social scientists, and mathematicians use almost universally. In this activity, because the racers run along a horizontal floor, it might be tempting to place distance traveled along the horizontal axis, which would not match the community convention.
Prediction can be tricky. Students might eyeball the trend of the graph, or might overlay with a ruler or draw in a curve to represent the trend, and use this to make their prediction. They might also just “connect the dots.” In 8th grade they will explore this type of relationship in much greater depth, and in high school, they will learn about “linear regression,” which is a rigorous way to construct a “line of best fit;” for now, focus on eyeballing trends. There is no guarantee that the trends on these graphs are linear (line-shaped).
In eighth grade, students will more formally explore and analyze relationships between quantities that change together; see the 8.SP.1-3 standards below. In the final activity of this learning cycle, it is important to realize that this is a first, foundational exposure to an idea that will take many experiences to develop; so in this cycle we should not attempt to develop any formal tools beyond the scatterplot and general discussions of patterns it might display.
8.SP Investigate patterns of association in bivariate data.
CCSS.MATH.CONTENT.8.SP.A.1
Construct and interpret scatter plots for bivariate measurement data to investigate patterns of association between two quantities. Describe patterns such as clustering, outliers, positive or negative association, linear association, and nonlinear association.
CCSS.MATH.CONTENT.8.SP.A.2
Know that straight lines are widely used to model relationships between two quantitative variables. For scatter plots that suggest a linear association, informally fit a straight line, and informally assess the model fit by judging the closeness of the data points to the line.
CCSS.MATH.CONTENT.8.SP.A.3
Use the equation of a linear model to solve problems in the context of bivariate measurement data, interpreting the slope and intercept. For example, in a linear model for a biology experiment, interpret a slope of 1.5 cm/hr as meaning that an additional hour of sunlight each day is associated with an additional 1.5 cm in mature plant height.
Mathematic Standards
Develop understanding of statistical variability.
Recognize a statistical question as one that anticipates variability in the data related to the question and accounts for it in the answers. For example, "How old am I?" is not a statistical question, but "How old are the students in my school?" is a statistical question because one anticipates variability in students' ages.
Understand that a set of data collected to answer a statistical question has a distribution which can be described by its center, spread, and overall shape.
Recognize that a measure of center for a numerical data set summarizes all of its values with a single number, while a measure of variation describes how its values vary with a single number.
6.SP.A
6.SP.B
6.EE.C.9
SMP1
SMP6
Materials For This Cycle
| Material | Quantity | When Used |
|---|---|---|
| Clipboard with lab sheet, several pieces of graph paper and pencil | 1 per team | Throughout |
| Ramp (40” long by 7.5” wide, ¼” bumpers along each edge) | 3 per classroom | Challenge, Lesson 1 |
| Shears for cutting corrugated cardboard | 1 per team | Challenge |
| Hot glue gun | 1 per two teams | Challenge |
| Measuing tools: a variety of seamstress tapes, carpenter's tapes, yard/meter sticks, and rules | At least 2 devices per team in one classroom collection | Challenge, Lesson 1 |
| Material | Quantity | When Used |
|---|---|---|
| Lab sheet | 1 per student | Challenge, Lesson 1 |
| Blank paper | 2+ sheets per student | Challenge, Lesson 1 |
| Corrugated cardboard 4" x 8" -- corrugations going across short dimension (source: enough for 1440 cars or enough for 72 cars) | 2 per team | Challenge |
| 12" bamboo skewers | 2 per team | Challenge |
| Large craft sticks | 2 per team | Challenge |
Large collection of wheels
| Each team will choose 4 | Challenge |
| Variety of tape | Challenge | |
| Variety of rubber bands | Challenge | |
| Hot glue sticks | Challenge | |
| Plain legal or letter size paper | 2 per team | Challenge, Activity; Lesson 1 |
| Grid poster paper | 1 sheet per team | Lesson 1 |
| Pennies for weights (or equivalent weights that are easy to collect and distribute in quantity; choose the same weights for the entire class: dominoes, decks of cards, small blocks, base 10 flats, heavy washers) | $1 (2 rolls) per team (250 grams per team) | Lesson 1 |
| Small dixie cups for holding pennies on racers | 1 per team plus a few extra | Lesson 1 |
Lessons:
Learning Cycle Wrapup:
Teacher-led summary discussion: Lead a discussion about things that students have figured out through this cycle. Be sure to discuss and record ideas, and draw out students to explain more. Be sure the following areas are raised, by either students or teacher:
- Ways to make a racer that rolls well
- Methods of changing how far the racer will roll, including by varying weight
- Ways to record data (including in a table)
- Recognition that data varies: the racer didn’t always go the same distance, even when you didn’t change anything
- Average (mean) as a way to describe a “typical” value
- Graphing data as a way to spot trends and patterns
- Language to describe trends and patterns, e.g. “The distance went up with increasing weight, until it got too heavy” (refined from “the dots go up”)
- Using trends in graphed data to predict
- Thinking about the limits of that kind of prediction (predicting in between data vs predicting beyond data)
Assessment:
Progress in Standards for Mathematical Practice (SMP) assessment
Growth in SMP 1 (Make sense of problems and persevere in solving them) and SMP 6 (Attend to precision) should be assessed via teacher observation and monitoring during the team work phases of the lessons. Keep notes at the student level about
- Student perseverance: are students struggling with problems longer? Is that struggle productive? What evidence do you see of this?
- Attending to precision of language: are students getting better at describing observations and discoveries to each other in more precise, meaningful language? (e.g. “The distance traveled went up as the weight increased” as opposed to “they go up”)
- Mathematical precision: Are students using appropriate precision in measuring, recording, and graphing so that the constructed graphs are useful for predicting? Do you see them refining their work to increase precision?
- Pedagogy note: “Attend to precision” does not mean “be more precise;” but rather, “use precision appropriate to the task.” So arguments over measurements at the 1/16-inch level represent too much attempted precision here, because our tools and apparatus don’t have that level of repeatability; but measurements to the nearest foot are too imprecise because they may obscure differences.
Progress in Mathematical Content Assessment
Some possible assessment items:
- Given a table of data for a hypothetical situation (either someone else’s racer or a totally separate situation), predict the “dependent variable” for some values of the independent variable that are not represented in the table. Best to include some value of the independent variable that are outside of the realm of reasonableness for the situation--for example, in the racer situation, 50 pounds of weight or “your weight (you sitting on the racer)”
Given someone’s notes on four trials of of some task, with one clear outlier--e.g. Sabah ran the 50-meter dash four times, and her partner recorded her times with notes:
- 8.4 seconds
- 13 seconds, tripped at the beginning
- 9 seconds, started in a crouch
- 7.9 seconds, right before lunch
What would you say is Sabah’s “typical” 50-meter dash time? Explain why you chose that time, and explain some reasons why Sabah doesn’t run in exactly that time each time she runs. (one possible solution: 13 seconds thrown out because the trip made it non-typical, average other three times; times vary because of wind, tiredness, people shouting, etc.)
Progress in Maker Mindset Assessment
In team work and discussion times, observe for and record instances of
- Students willing to try things when they aren’t sure they will work, then trying to fix issues (rapid prototyping)
- Students learning from others’ discoveries (scouting)
- Students effectively sharing their own and listening to/taking on others’ ideas in their teams (group work)
- Students making predictions, with reasoning (Guess what will happen)
- Students keeping good documentation
Teacher Reflection:
Make some notes for next time:
- Did students all have access to the activities?
- Did I maintain cognitive demand/productive struggle by resisting doing the students’ thinking for them?
- Did the activities provide opportunities to fail, and then learn from those failures?
- Did the activities help the mathematical ideas of average, graphing data, and predicting more meaningful and accessible to my students?
- What should I try next time to increase the productive struggle my students exhibit in this cycle?
Credits and Sources:
Sonoma State writing team: Ben Ford, Carol Keig, Brigitte Lahme, Kathy Morris
Project Make the Way teacher pilot-test teams