Lesson 3: Making Changes
In an opening discussion about simple modifications, class will decide to investigate the effect of weight on distance traveled. Each team will use pennies to adjust the weight of their car, and test 4 different added weights, with three trials at each weight; they will calculate the average distance traveled for each amount of added weight.
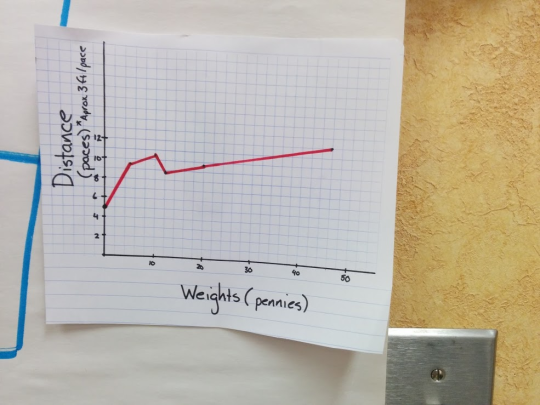
After gathering their data, each team will plot their average distance for each weight on a distance vs. added weight graph (distance on vertical axis, added weight on horizontal).
Finally, each team will use their graph to predict distance for a weight not already tested, then test their prediction (again using three trials).
Activities:
25 minutes
Setup
Same as end of challenge: Ramps set up for use, each team with its racer and its line plot.
Narrative
An intro discussion will move the focus to investigating the effect of weight on distance traveled. Students should be trying to predict what will happening (and give reasons for their predictions), looking for patterns as they work, and paying attention to precision in their measurements.
Launch
Recall the discussion at the end of the previous lesson about factors affecting how far the racers go. If weight came up, recall that and say you’d like to explore that effect. If it didn’t come up, share a story like “I notice that my kid’s wagon seems to roll down the hill at a different speed if there is someone in it, than if it is empty. I’m wondering if that will be true for our racers as well?”
- Do you think your racer will go farther or less far if you add some weight to it? Why?
- Today we want to see if changing the weight has an effect on how far the racer goes, and if so, how much of an effect.
- Did any of you try adding weight when you built your car? Did you notice anything?
- I’d like you to use these pennies to add weight to your racers
- You already have a “typical distance” for your racer without any added weight
- I now want you to pick four different amounts of “added weight” that you think your car can hold, and figure out a “typical distance” for each of those.
- You should tape a cup to your car to hold the pennies
- We don’t have time to do 7 trials for each weight, so we will just do three. This time, for your “typical distance” for each weight, use the average, or mean, of those three trials.
- [quick reminder of how to calculate mean]
- Hand out the Changing Weight data sheet (one per team) for their record keeping; point out that they should use their “typical distance” from last time for the 0 added pennies average
- Weights should vary by at least 9 pennies
| Added Weight | Trial 1 distance | Trial 2 distance | Trial 3 distance | Average |
|---|---|---|---|---|
| 0 pennies | ------------ | ------------ | ------------ | (from last time) |
| _ pennies | ||||
| _ pennies | ||||
| _ pennies | ||||
| _ pennies |
Task Statement
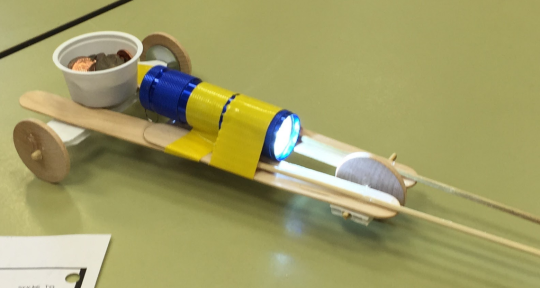
Investigate the effect of added weight on the distance traveled by your racer, using pennies as weights and recording all your data in a table.
Orchestrating & Monitoring
- Make sure teams are varying their weight significantly: There should not be weights closer than 9 pennies. So this collection of added weights would work: 12 pennies, 25 pennies, 40 pennies, 60 pennies; but 8 pennies, 50 pennies, 56 pennies, 70 pennies would not (both because 8 is too close to zero and 56 is too close to 50).
- Be sure teams are recording their distances and weights
- If teams have a run that hits a wall or a foot, allow them to not use it as one of their trials. But they need to be able to identify the cause of the abnormality; can’t be discarded just because they didn’t think it went far enough
- No modifications other than adding weight, though repairs are fine. Ensure minimal tape use so that weight of the tape does not become an issue
- Watch for teams that find a consistent increase in distance for added weight, and others that have an increase followed by a decrease in distance as weight increases.
- Keep an eye on calculations of averages, and ask others in team to explain calculations, if one member seems to be dominating this work
Discussion
No discussion for this activity; leads directly into following activity.
Anticipated Misconceptions and Challenges
It might be hard to resist modifying the racer. Try to make sure that repairs to parts that break or stop functioning are the only work on the racer itself.
25 minutes
Setup
Each team needs a poster-sized sheet of grid paper, markers, and table or floor space.
Narrative
In this activity, students will plot their data on a coordinate plane, and then use that plot to predict. First the class will agree to put distance traveled on the vertical axis and added weight on the horizontal axis; then teams will have to choose scales for their two axes; then they can plot. Finally, each team will pick an amount of added weight different than any they have already tested, and predict distance traveled, then test it.
Launch
- What did you find when you added weight? Did your racers go farther, less far, or no change?
- When I look at all your tables, it is hard for me to see whether there are patterns in all those numbers. Could we make a picture of them somehow, so it would be easier to understand? [take ideas; hopefully someone mentions graphing]
- Last time, we graphed our distances for our racer using a dot plot.
- Today, we will graph our average distances for different weight on a graph with two axes, one for the distance traveled and one for added weight.
- Explain the convention of placing the quantity that you have control over on the horizontal axis, and the quantity which is maybe being affected on the vertical axis.
- Once you have plotted your five data points [one for no added weight--which should end up on the vertical axis--and one for each “added weight” amount], pick an amount of added weight that you haven’t tested, and use your graph to predict the distance for that weight. Draw and label your prediction on your graph
- Test the new amount of added weight, again using three trials and taking the average
Task Statement
Plot your data on a graph on the chart paper, using distance on the vertical axis. Pick an amount of added weight that you didn’t test, and use your graph to predict distance for the racer. Test it!
Orchestrating & Monitoring
- Make sure teams are following the convention of putting distance on the vertical axis and added weight on the horizontal axis
- Prompt teams to include their “0 added weight” point on their graph [these go on the vertical axis]
- Make sure teams are setting up reasonable axis scales, considering the full range of data they have to plot. If you see that some data will be off the paper, ask where they plan to place “the xx data point?” If scales are too compressed, encourage teams to think about scales that will spread the data over more of the paper
- Monitor graphing, asking for explanations of placement often. Ask other members of the team besides the one wielding the markers
- When groups are predicting, ask them how they are making their predictions
- Look for at least one group which is predicting within the range of weights already tested [interpolating] and one which is predicting beyond the weights already tested [extrapolating]
Discussion
When all groups have their data plotted and have predicted a distance for a new weight (even if not all have tested it yet), put all posters up and ask a few groups (which used different methods) to describe patterns they found and how they used them to predict (don’t focus on the testing and comparing it to predictions yet). One possible sequence, if you have these various approaches represented:
- A team with a clear upward trend, that picked a new weight within the range of tested weights, and eyeballed a point on the graph that fits the trend
- A team with a clear trend in either direction, which drew in a line or curve to model the data, and used that to predict
- A team without a clear trend
- A team that connected dots and used that to predict
- A team that chose a weight outside of the original range of weights, and either eyeballed or drew in a trend line/curve--especially if you have a group that chose a weight so big that the car was disabled by the weight in some way
Important points to raise in the discussion
- Some data sets exhibit a trend which we can use to predict; others perhaps less so
- Variability caused by factors other than weight might make the effect of weight hard to spot in this data
- Even when points do not all exactly fit in a clear pattern, we can still see trends and might be able to draw in something to show the general relationship
- Some trends might look like a line; others could be curved in various ways
- Identified patterns can be used to predict: If a team sketched a line to represent a pattern but didn’t place their predicted point on that line, that’s an excellent place to center a discussion
- Trend curves or lines have limits: If we put 300 pounds on your car, would it go farther? [no, the car would collapse]
Anticipated Solutions
For representing trends/patterns:
- Connecting dots from 0 added weight to most added weight
- Sketching in a line or curve through the middle of the data
- Verbal description “they go up;” “they go up then down;” “we can’t see any pattern.”
For predicting:
- Using sketched-in pattern lines/curves--placing new dots on them, above the new weight on the horizontal axis
- Eyeballing a point roughly in line with any trends apparent in measured data
Anticipated Misconceptions and Challenges
The most difficult challenge here is seeing the 2-dimensional plot as representing a relationship between two changing quantities. Ask questions to pull out phrases that describe the graph in terms of the quantities represented:
- If a student says, to describe a trend: “it goes up,” try to ask questions to get to “as the weight goes up/increases, the distance traveled goes up/increases.”
10 minutes
Whole-class discussion:
To try to generalize concepts from this lesson, discuss other things that might be varied about the racer situation, and ask what trends students might expect to see in the relationship between those things and distance traveled. Possibilities (it’s OK for the teacher to bring these up):
- We could try different sized wheels [some might think that bigger wheels would lead to more distance]
- We could prop the ramp up higher [some might think higher ramp would lead to more distance--if so, ask what distance they would expect with a vertical ramp (0 inches!)]
- We could do it on different floors [smoother floor would likely give longer distance]
Finally, emphasize the importance of understanding relationships between changing quantities. Ask for some other examples: If I tell you that my friend has two dogs, and Amber is heavier than Bellia, what is something else that is likely to be true about them [e.g. Amber eats more food, Amber can run faster, … These are not necessarily the case, but as general patterns it is true that larger dogs eat more, run faster, and in fact have shorter life spans]
Timeline:
Activity 1 - Changing Weight: 25 minutes
Activity 2 - Plotting and Predicting: 25 minutes