Lesson 2: How Far Does It Go
In this brief lesson (which could be combined with the lesson before or after, if time is available), teams will test their racers seven times, without making changes except to fix pieces that fall off or malfunction. After obtaining seven measurements, they will display their measurements on a dot plot and use that plot to choose a “typical” value for the distance traveled by their racer. The purpose is to understand that the quantity “how far our racer goes” is a quantity with some variability, which nevertheless can be summarized by giving a “typical” value, with the dot plot representing the amount of variability in the quantity.
Activities:
30 minutes
Setup
Ramps set up around room as for Challenge lesson; teams will need their racers and their clipboards with blank paper, as well as access to measuring tools.
Narrative
Student teams will gather and display data about the distance their racer travels. Each team will record the distance traveled for 7 trials of their racer (measuring from the bottom of the ramp to the rear of the racer in a straight line). They will display their data on a dot plot, and propose a distance that represents a “typical” trial for their racer. The discussion at the end will compare methods for identifying the “typical” trial distance, without pursuing any explicit “average.”
Launch
- Remind students of the discussion at the end of the previous lesson (about how we don’t expect our racers to go exactly the same distance every time they run, and that we agreed to measure from bottom of ramp to rear of car).
- Hand out clipboards and ask teams to record the distance traveled for 7 trials of their racer (with no changes to the racers between trials except repairs), and to display them on a dot plot. An example of a dot plot on a board will be helpful; make sure your example has at least one repeated number so you can show how dots are stacked.
- They can note any special circumstances at data points that need them, and when they have done their 7 trials, they should pick a distance that is the “typical” distance for their racer, and indicate that distance on their dot plot in a different color. They should be prepared to explain why they chose that “typical” distance.
- Give 20 minutes for the data gathering and dot plot preparation.
Task Statement
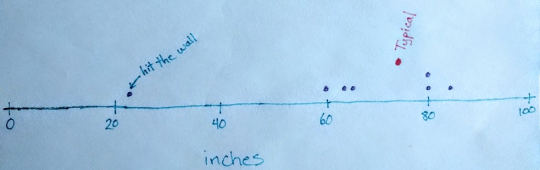
Your job is to run your racer 7 times, record all 7 distances (we call these distances our “data”), and display them on a dot plot like this (show on board). If some of the runs need special notes, just write that on the dot plot. Then pick a “typical distance” for your racer, based on your data, and show that typical distance on your dot plot in a different color. Be ready to tell us all why you picked the typical distance that you did.
Orchestrating & Monitoring
- Watch the time and make sure teams are getting their runs completed in a timely fashion.
- Watch for conversations about whether to include atypical trials (“it hit the wall, it doesn’t count”) and encourage teams to include all runs but note special circumstances. In the discussion at the end, teams can explain why they excluded these “outliers” from determining their “typical” distance
- Listen for discussions about how to pick the typical distance: Try to find a team that picks a “middle of the pack” number and another that picks the “most common” number (the “mode”). These are both reasonable approaches to naming a “typical” distance or “central tendency;” in the discussion at the end, we will settle on arithmetic average (“mean”) which is a “middle of the pack” value.
Discussion
This 5-10 minute discussion should include these points about statistical variability
- Did anyone’s car go the same distance on every run? Why not?
- Display all dot plots, and focus on typical distance choices. Ask at least two selected teams to share their approach. There is no “right” answer here.
- Make sure the issue of excluded values is raised, and a discussion had about why a team didn’t include a value in choosing its “typical” distance, which can be a very reasonable thing to do (statisticians do it)
- If there are dot plots with an inconsistent scale (not equal spacing along axis), try to draw a comparison between that and one with a consistent scale, and point out that on number lines, we try to keep the spacing the same between numbers, so that this distance (hold up 2 fingers) represents the same difference of numbers no matter where on the number line we are
- Discuss strategies for setting up the scale on a dot plot to make the shape of the data as apparent as possible--using the available space as fully as possible. This will help teams set up their scales in the graphing activity to follow
Anticipated Solutions
In selecting a “typical” distance, some may take a middle of the pack distance (visually), some may take the most-repeated distance (if any), and some may take an arithmetic average (sum/#readings).
If some trials have special circumstances (“it hit my foot”), teams may decide to leave those trials out when picking the “typical” distance. This is (sometimes) appropriate; this lesson is not the place to get into when it’s appropriate to exclude data points, but it is important to acknowledge that there might be times when it is appropriate.
Anticipated Misconceptions and Challenges
One possible challenge may be accepting a distance that did not occur at all as a representative “typical” distance (for example, the arithmetic mean may well be a distance that never occurred as a data point).
5 minutes
Brief discussion: Next time, we want to explore simple changes we might make to racers, to make them go farther. What are some things you tried, or things we might try?
Record ideas, without evaluation, and have teams store their racers and dot plots for next time.
Timeline:
Activity 1: 30 minutes
Synthesis: 5 minutes